SugarCharts
Line, bar, heat, candlestick & braille charts for any terminal

Sparkline, Bar, Line, Heatmap, Scatter, TimeSeries, Streamline, Waveline, OHLC, plus inline image rendering via Sixel / Kitty / iTerm2 protocols. Picture::detect() is multiplexer-first — it declines under tmux/Zellij (where image escapes are swallowed) unless CHARTS_PICTURE_PASSTHROUGH=1, then routes iTerm2/WezTerm/kitty/Foot/mlterm/Windows Terminal on TERM / TERM_PROGRAM; everything else is explicitly configured.
Install
composer require sugarcraft/sugar-chartsNo tagged releases ship yet — Packagist serves the dev-master branch only, so name it explicitly; on a default-stable project a bare sugarcraft/sugar-charts request does not resolve.
Quickstart
// The snippets assume a composer project with this package installed and require 'vendor/autoload.php'; in scope.

use SugarCraft\Charts\Sparkline\Sparkline;
use SugarCraft\Charts\BarChart\BarChart;
use SugarCraft\Charts\LineChart\LineChart;

echo Sparkline::new([1, 3, 2, 8, 5, 4, 7, 6], 8)->view() . PHP_EOL;
// " ▂▁█▅▃▇▆" (scaled to the window's minimum and maximum; the minimum maps to the blank leading cell)

echo BarChart::new(
    [['cpu', 0.7], ['mem', 0.4], ['disk', 0.9]], 20, 5
)->view() . PHP_EOL;

echo LineChart::new([1, 4, 2, 8, 6, 3, 7], 30, 6)->view();
What's in the box
Style. Foundation for the grid renderers (LineChart, Heatmap, Scatter, OHLCChart, Waveline); Sparkline builds on sugar-cellbuffer and Picture emits raw protocol bytes.withMarkLines(), withFill(), withFractionalHeights().[DateTimeImmutable, value] tuples rendered through LineChart with time-range windowing; pre-aggregate with the Aggregation toolbox when points share a timestamp.detect() routes on TERM / TERM_PROGRAM (best-effort env sniffing, not a terminal query). When no protocol is detected, view() prints a plain-text placeholder — withProtocol() overrides the choice.LineChart::withSeriesColorFn() and BarChart::withBarColor() resolvers.Per-point and per-bar colors
btop tints every graph point and meter by its value through the theme gradient. LineChart::withSeriesColorFn(fn(string $dataset, int $x, float $value): ?Color) colors each sample's dot, fill run and outgoing connector ($dataset is LineChart::PRIMARY_SERIES for the unnamed series; $x is the index in the full series; null keeps the series color). BarChart::withBarColor(fn(Bar $bar, int $i): ?Color) colors each bar's body and eighth-block cap. Passing null restores byte-identical default output; a non-Color return throws UnexpectedValueException.
use SugarCraft\Charts\BarChart\{Bar, BarChart};
use SugarCraft\Charts\LineChart\LineChart;
use SugarCraft\Core\Util\Color;

$heat = static fn (float $v): Color => match (true) {
    $v >= 7 => Color::hex('#ff5555'),
    $v >= 4 => Color::hex('#f1fa8c'),
    default => Color::hex('#50fa7b'),
};

echo LineChart::new([1, 4, 2, 8, 6, 3, 7], 30, 6)
    ->withSeriesColorFn(
        static fn (string $dataset, int $x, float $v): ?Color =>
            $dataset === LineChart::PRIMARY_SERIES ? $heat($v) : null,
    )
    ->view() . PHP_EOL;

echo BarChart::new([['cpu', 0.7], ['mem', 0.4], ['disk', 0.9]], 20, 5)
    ->withFractionalHeights()
    ->withBarColor(static fn (Bar $bar, int $i): ?Color => $heat($bar->value * 10))
    ->view() . PHP_EOL;
Source & demos
- Source on GitHub
- Full README
- Runnable examples
- Originally inspired by ntcharts (Go); SugarCraft is developed as a native PHP project.
API
| Class | Method | Description |
|---|---|---|
| Sparkline | new(data, width) | Create sparkline chart |
| Sparkline | view() | Render sparkline |
| BarChart | new(bars, width, height) | Create bar chart |
| BarChart | view() | Render bar chart |
| BarChart | withBarColor(?Closure) | Per-bar color resolver fn(Bar, i): ?Color |
| LineChart | new(data, width, height) | Create line chart |
| LineChart | view() | Render line chart |
| LineChart | withSeriesColorFn(?Closure) | Per-point color resolver fn(dataset, x, value): ?Color |
| Heatmap | new(grid, width, height) | Create heatmap |
| Canvas | new(width, height) (constructor) | Create chart canvas |
Accessibility & readability.
Charts encode magnitude through color and glyph position — the channel that fails first in monochrome, for color-vision-deficient readers, and on high-contrast hosts.
The environment ladder (CLICOLOR_FORCE/FORCE_COLOR beat NO_COLOR, which beats CLICOLOR=0) is honored by every text renderer's view(): under NO_COLOR legends, bar bodies, heatmap fills and themed rules all come back SGR-free (image payloads are exempt — the escapes are the image).
Structural channels carry the same meaning without color: withDataLabels() prints bar values as text; cell-mode LineChart labels series with six plain-ASCII point runes; withRune()/withBodyRunes() swap glyphs — but Sparkline's block shades and BarChart's █ have no glyph setter today, and Unicode track glyphs assume the fleet's one-cell Ambiguous canon.
Braille output is a dot-grid density mode, not screen-reader braille: assistive technology should read the data (cells(), source arrays, CSV), not the picture. For low vision, Theme::ansi() keeps the 16-color tier and withMonoRamp(true) gives the heatmap a background-safe density ramp. For reduced motion, skip animation sweeps and render the final frame at progress 1.0.
Full guidance: README — Accessibility note.
Untrusted labels. Every string the library can echo is sanitized through SugarCraft\Charts\Support\UntrustedText: static labels are swept at their setters, and formatter closures (withXLabelFormatter(), withYLabelFormatter(), BarChart's withDataLabelFormatter()) are swept at the resolve and render sites, so hostile data cannot bypass the boundary. The Canvas and Graph layers that compose the frame are trusted internals and stay unguarded by design. Full story: README — Untrusted labels.
Demos.
Ten renderers · nine runnable examples · eight CI-recorded GIFs — the two example scripts without a recorded tape are animated_line.php and braille.php. Regenerated by CI on pushes to master that touch the tapes, examples, or source, and on manual workflow_dispatch.

Sparkline
Single-row series — eight Unicode glyphs.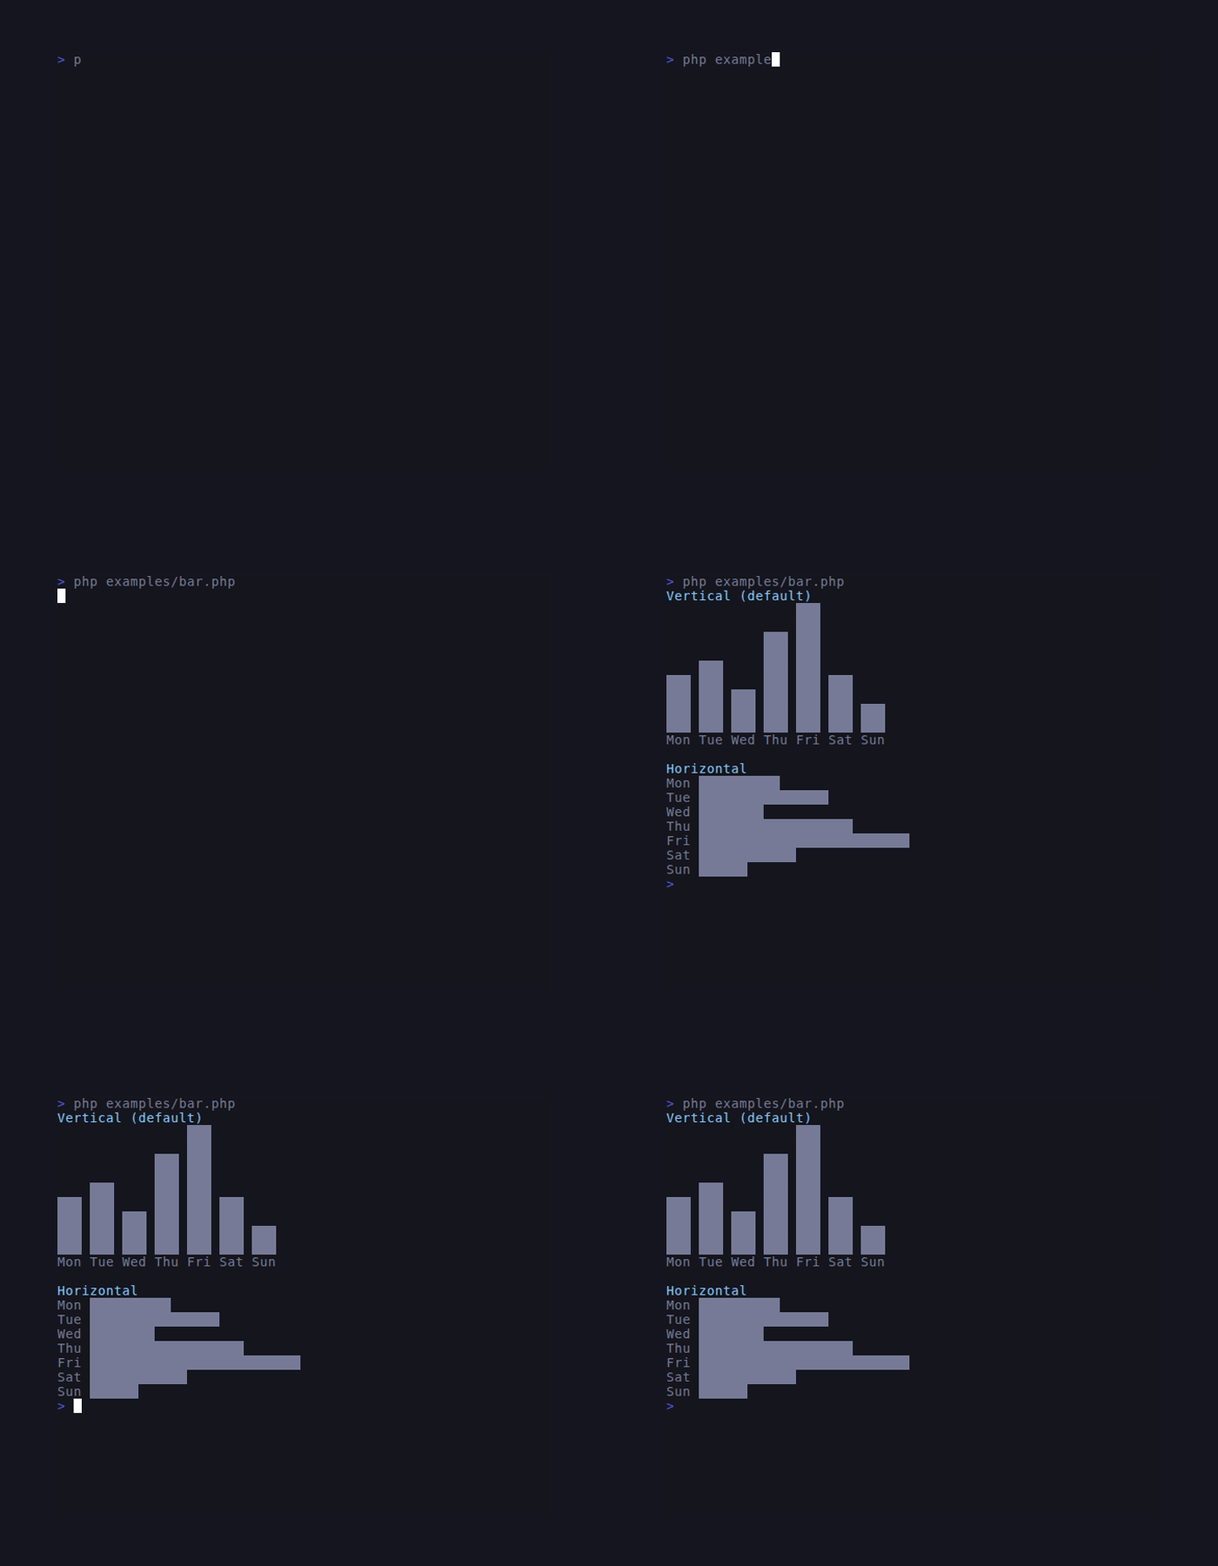
Bar chart
Auto-scaling labeled vertical bars.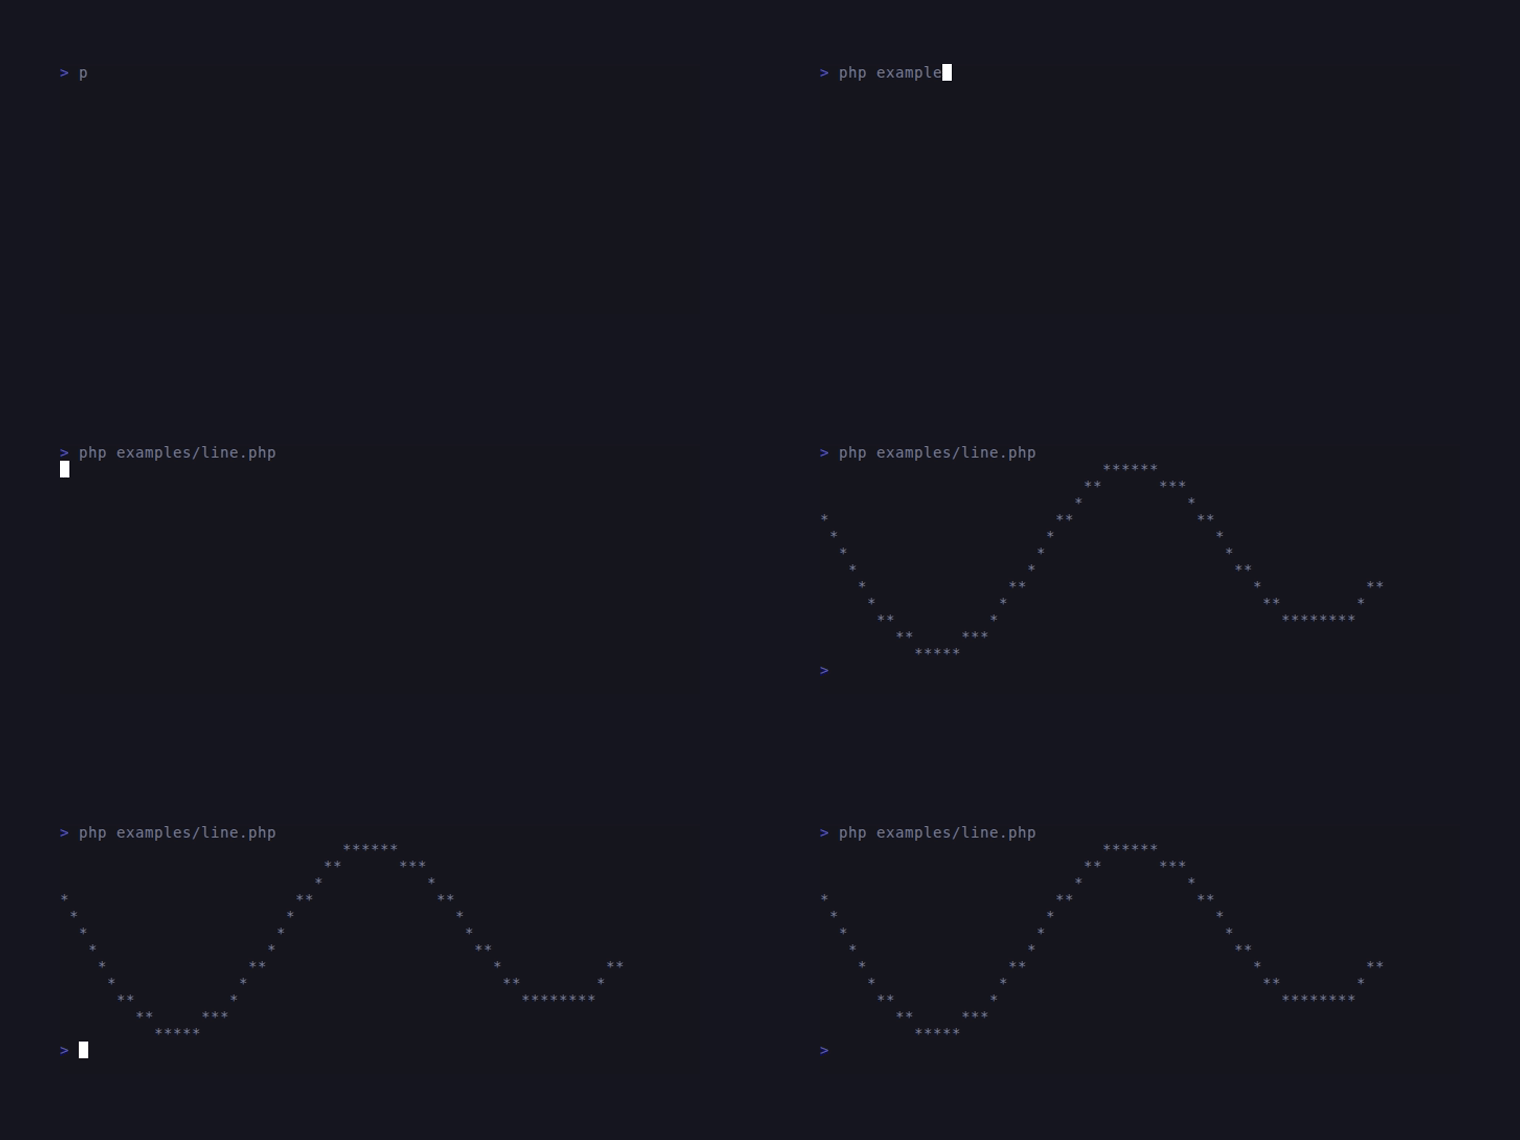
Streamline
Sliding-window stream — recorded fromexamples/line.php, which drives Streamline.
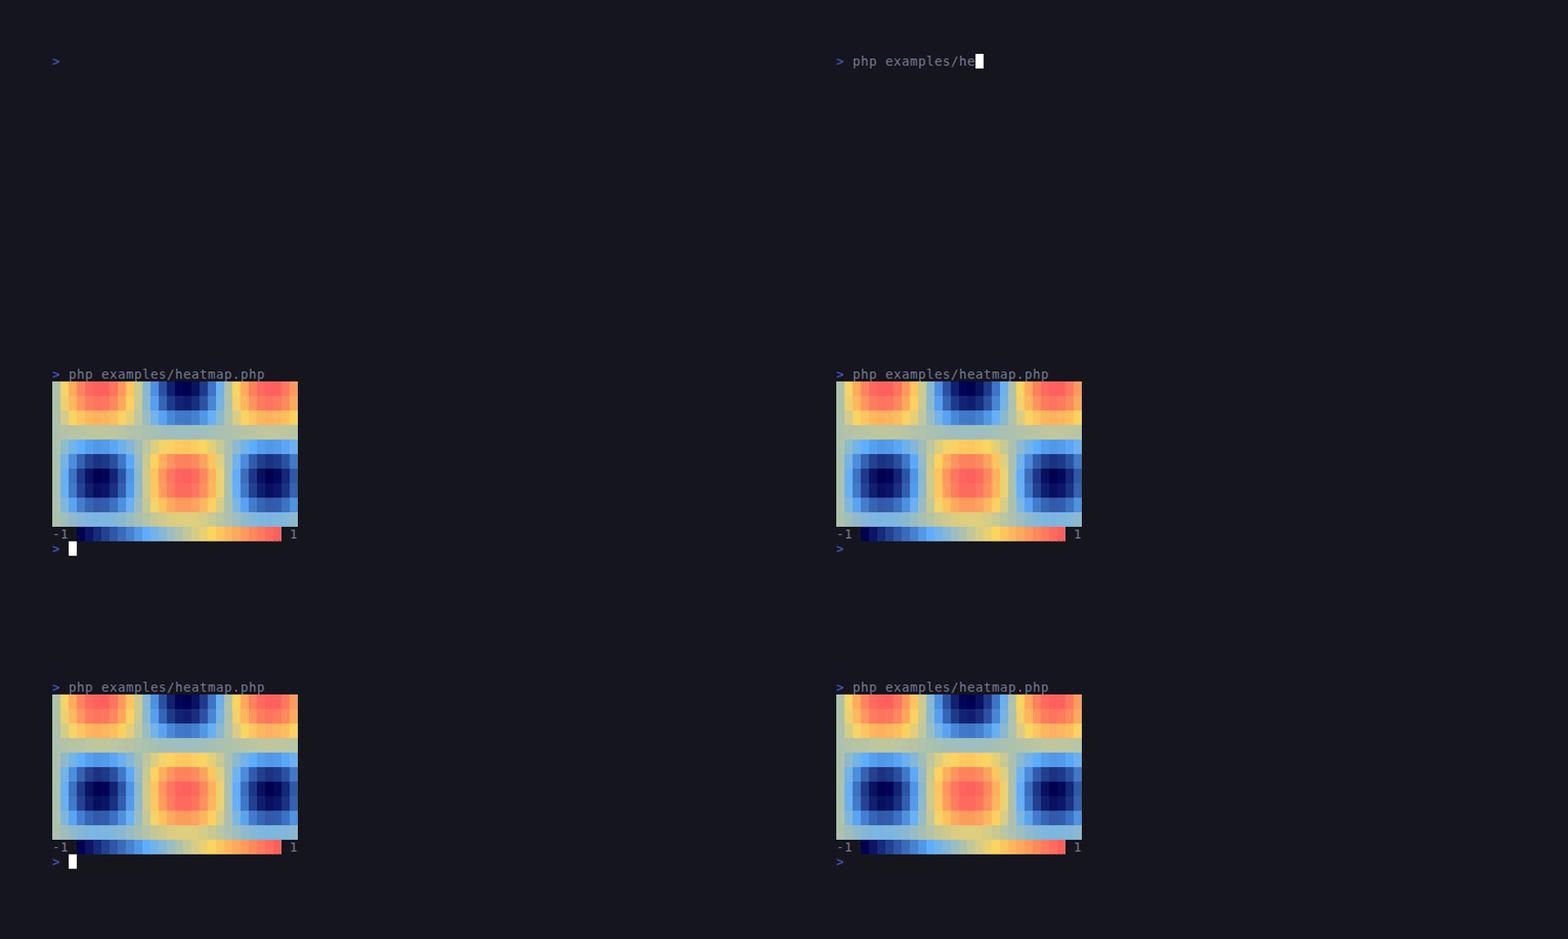
Heatmap
Density visualization with palette gradient.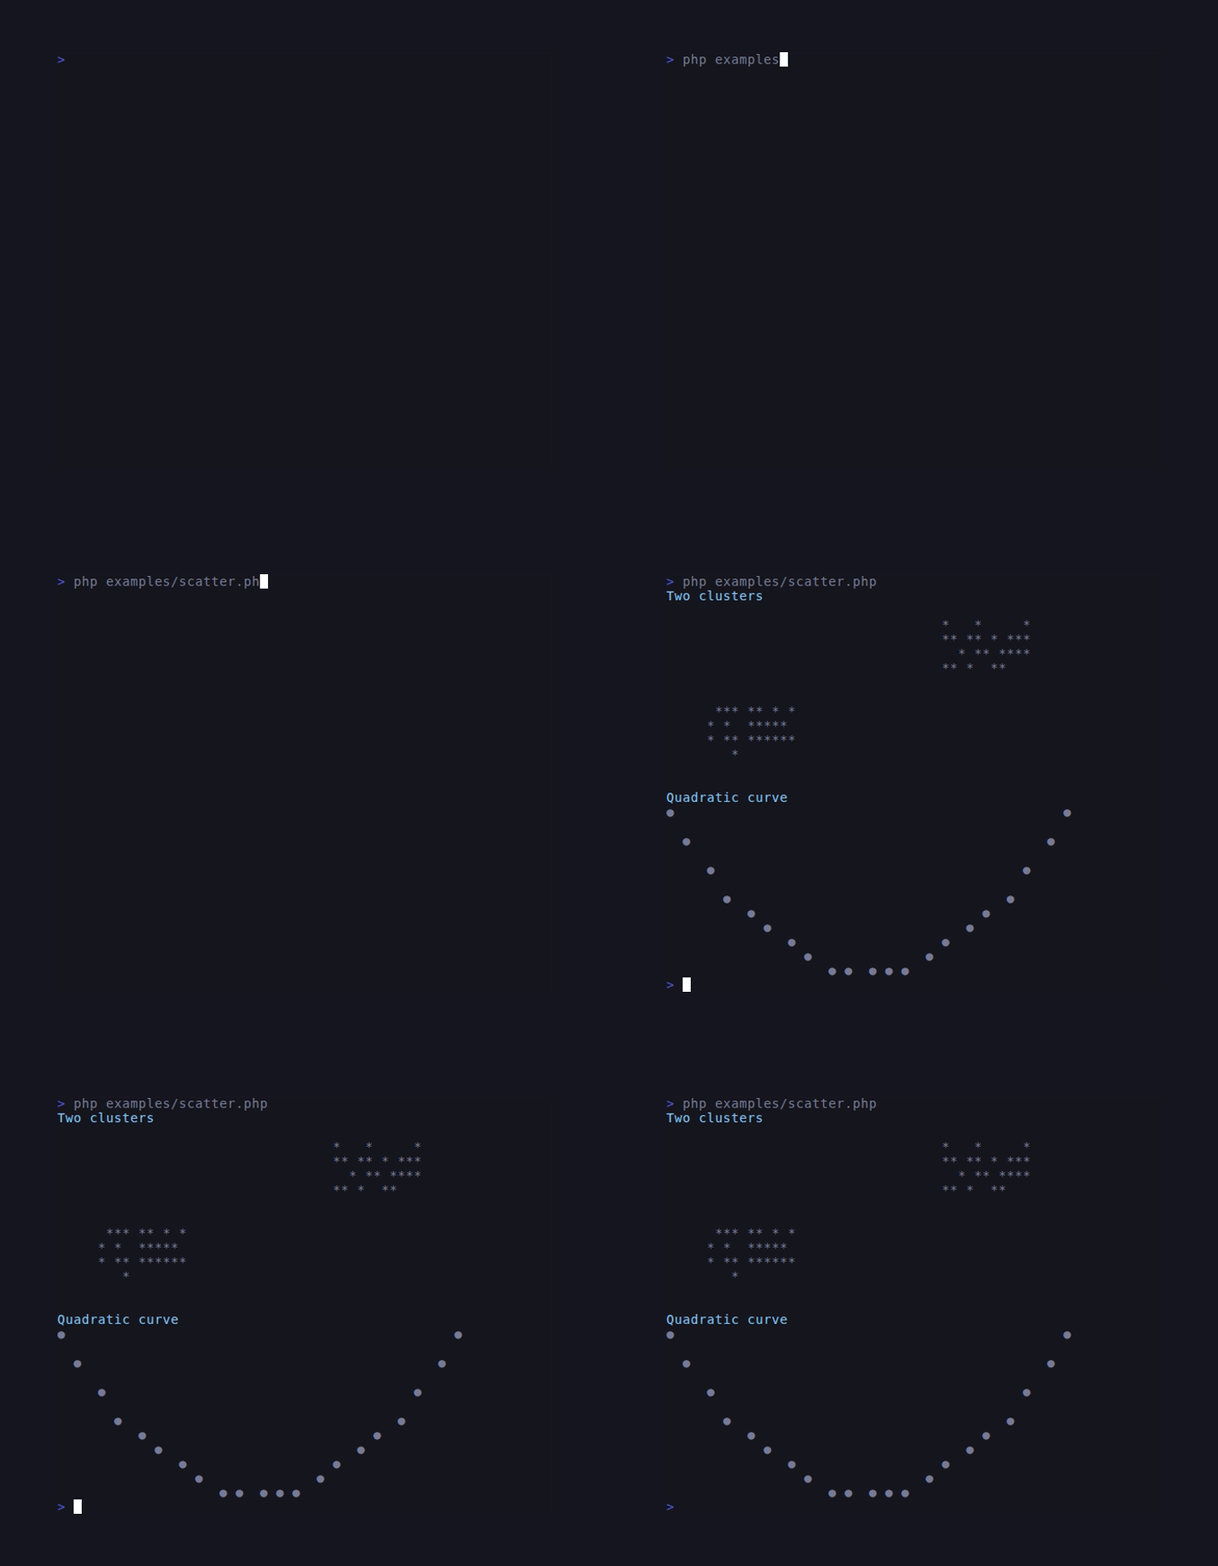
Scatter
Cell-quantised XY plot.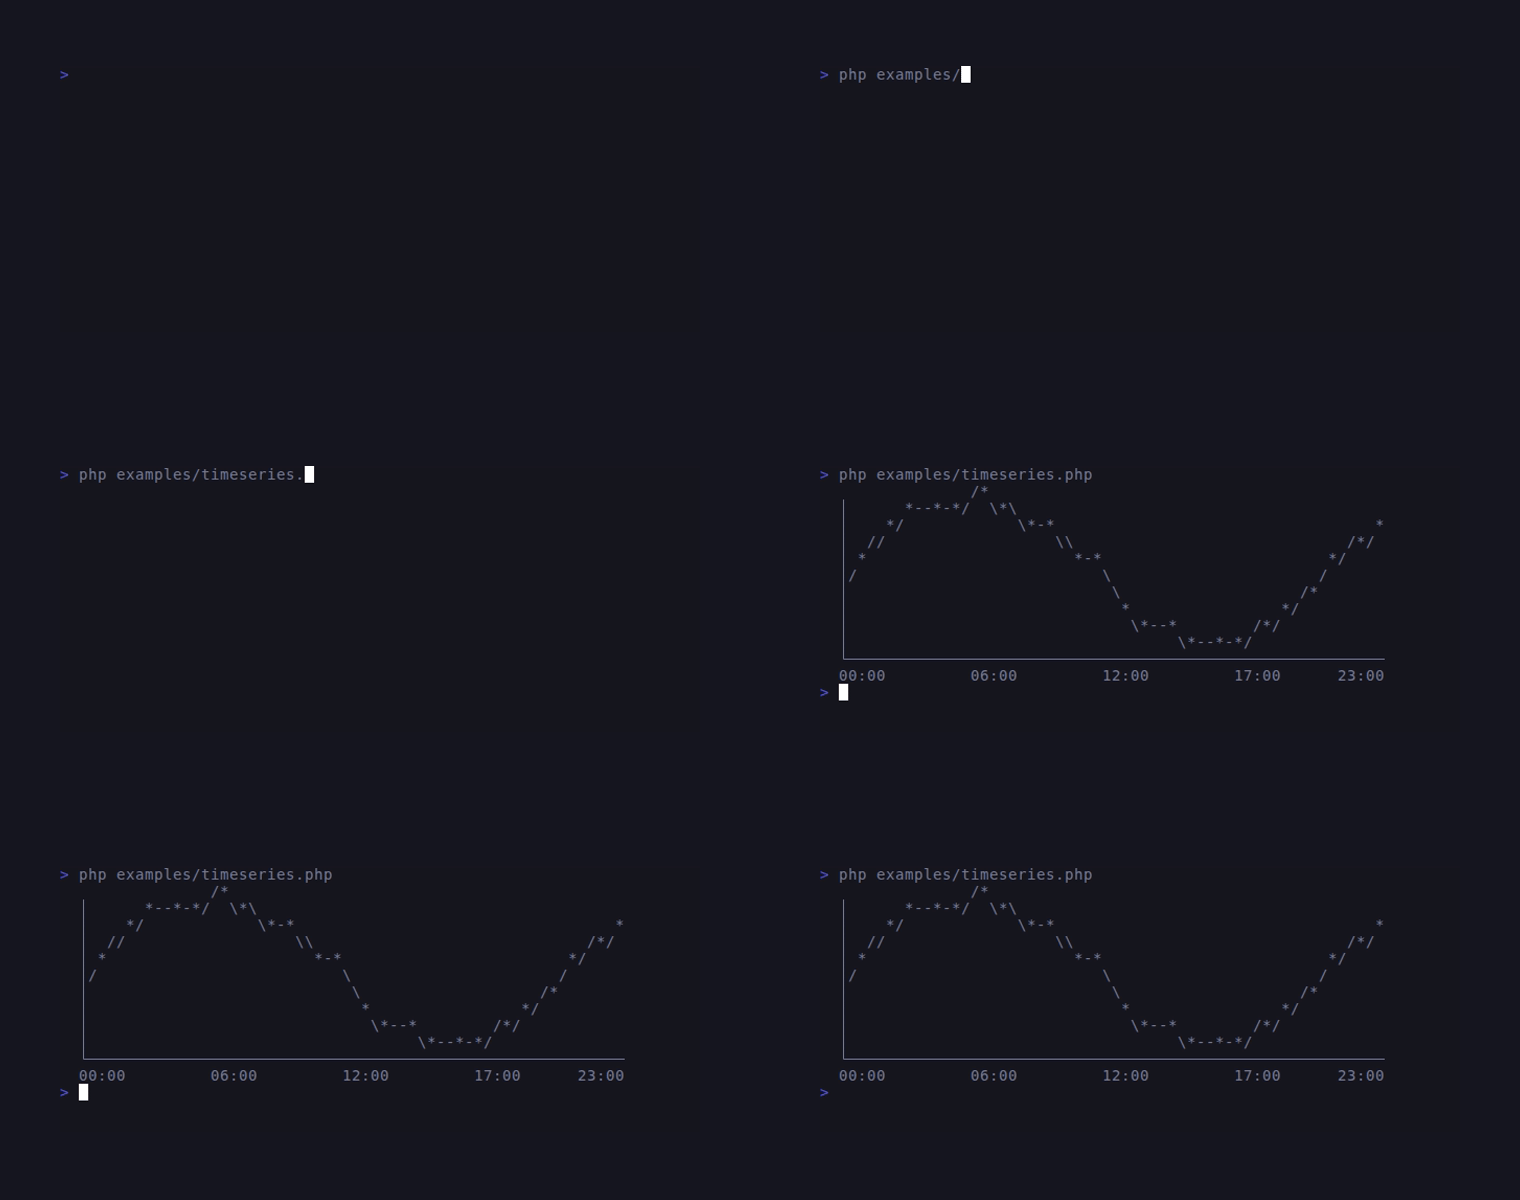
TimeSeries
Timestamped tuples rendered through LineChart.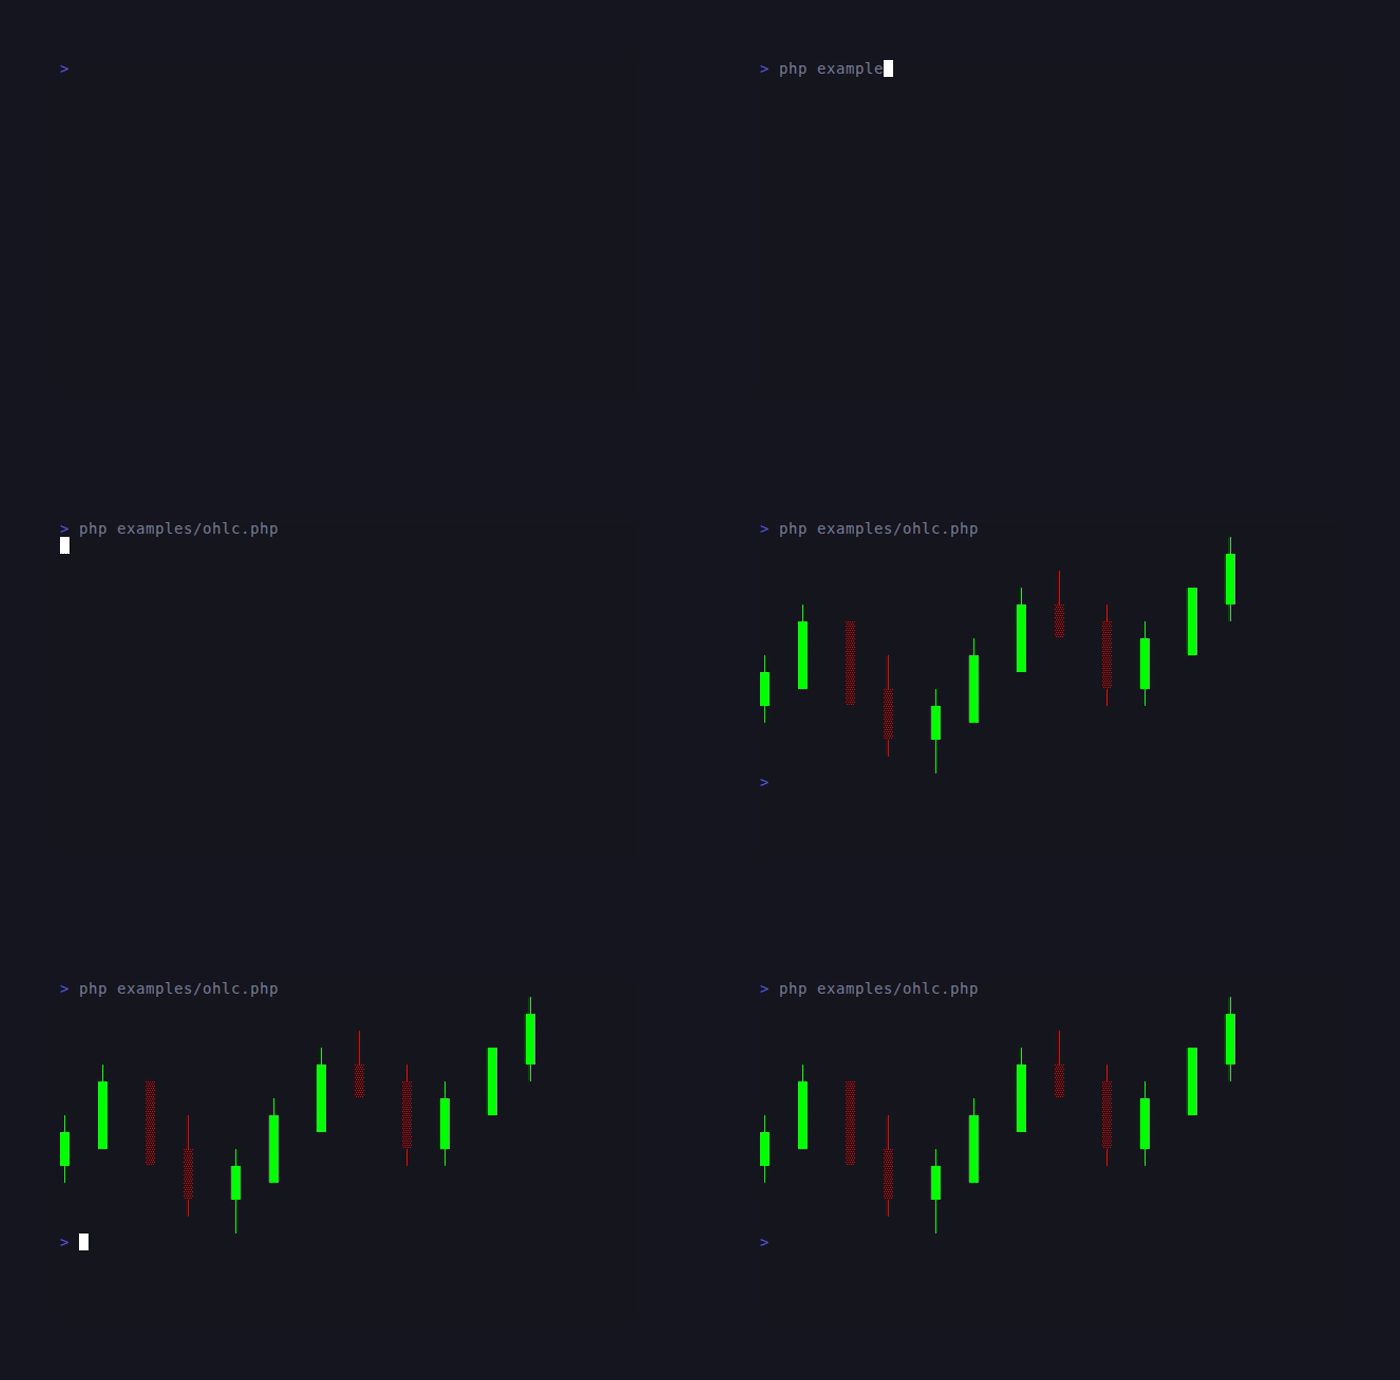
OHLC
Candlestick chart for financial data.